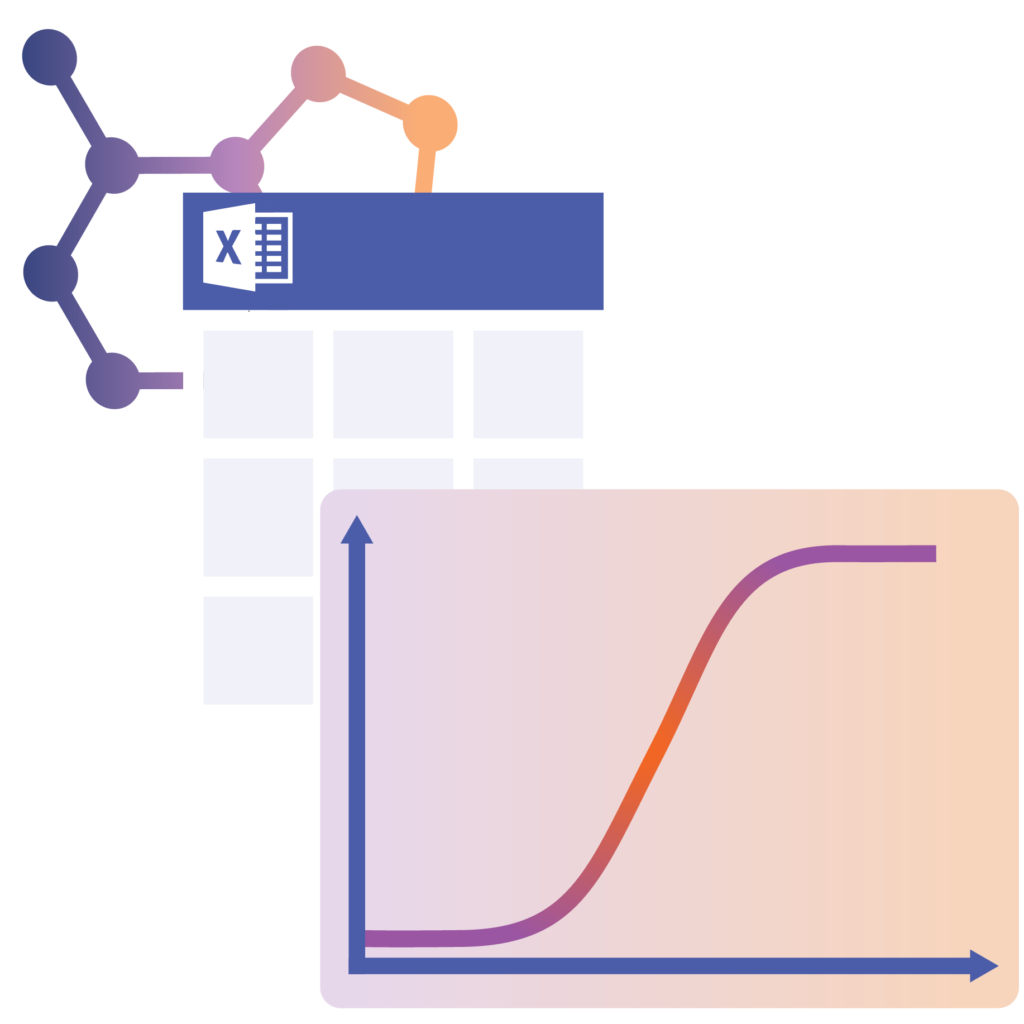
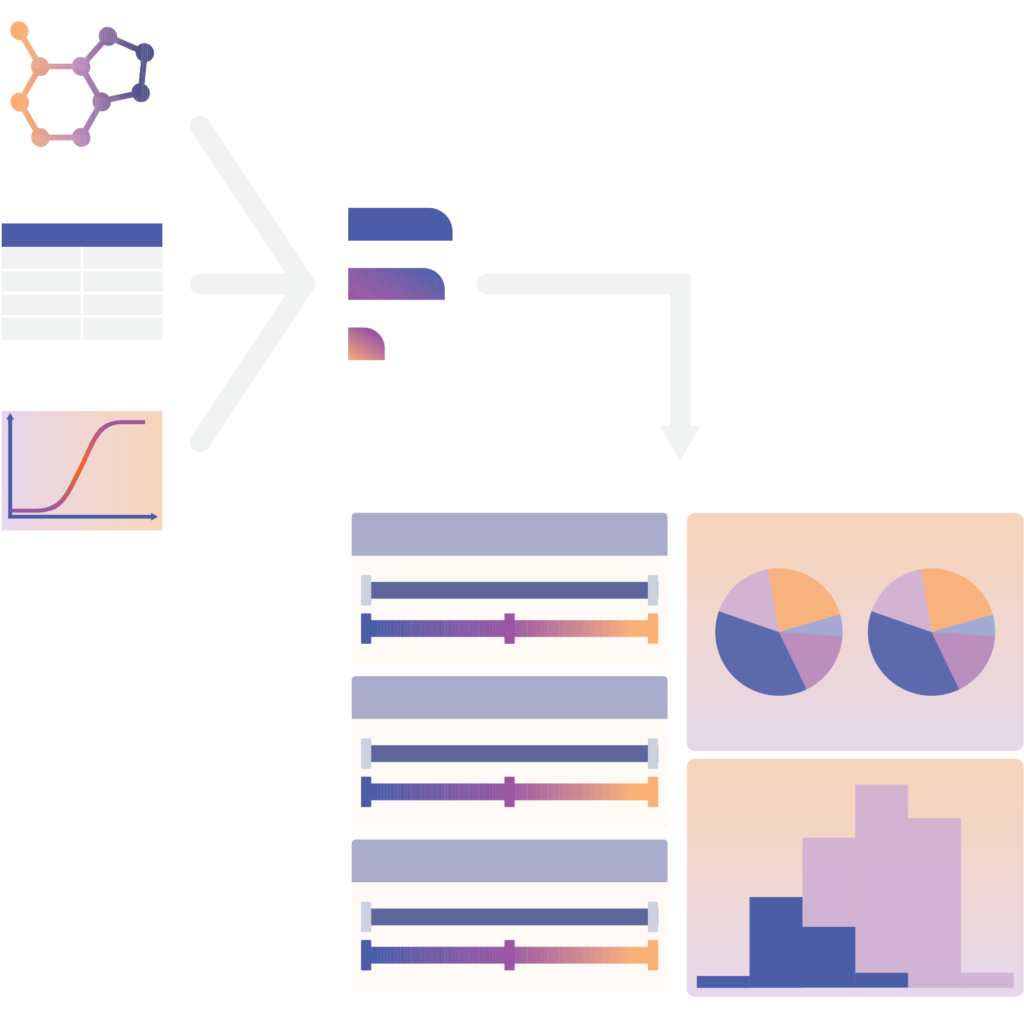
Data Visualization and SAR Analyzer

Focus is our web-based data visualization tool designed to help filter and analyze complex sets of chemistry and biology data. Focus integrates with RegMol data sets, and it can import data from external sources. Our SAR analyzer feature allows for easy R-Group decomposition, and our visualization tools help users sort and filter data with a variety of charting types.


Overview

  • Import data sets directly from RegMol (Scilligence’s compound registration system) or from external databases
  • Filter, sort, and visualize complex data sets
  • Conduct matched molecular pair analysis (coming soon)
  • Seamless SAR analysis with R-group decomposition
  • Share visualizations with your team for drug discovery collaboration

Features


  • Web-based data analytics and visualization
  • Integration with RegMol
  • SAR Analyzer tool
  • Import data from SD files
  • Data visualization through a variety of chart types
  • Define user roles for project level accounts
  • Create custom visualizations for individual or team use


Benefits

  • Users can easily visualize a variety of data sets 
  • Integration with Scilligence’s registration and bioassay database. 
  • Multiple charting options.

Deployment Options and Migration

Focus can be deployed on-premise or on the cloud. Our team has experience migrating data from all major solution providers. Multiple cloud options and central data center options are available. It is easy to switch from cloud deployment to on-premise and vice-versa.

Security Features

  • Each installation and deployment is a separate instance
  • Secure and encrypted web link via https channel
  • 2 factor authentication
  • Strong passwords enforced
  • IP address can be restricted
  • Added VPN security for on-premise deployment